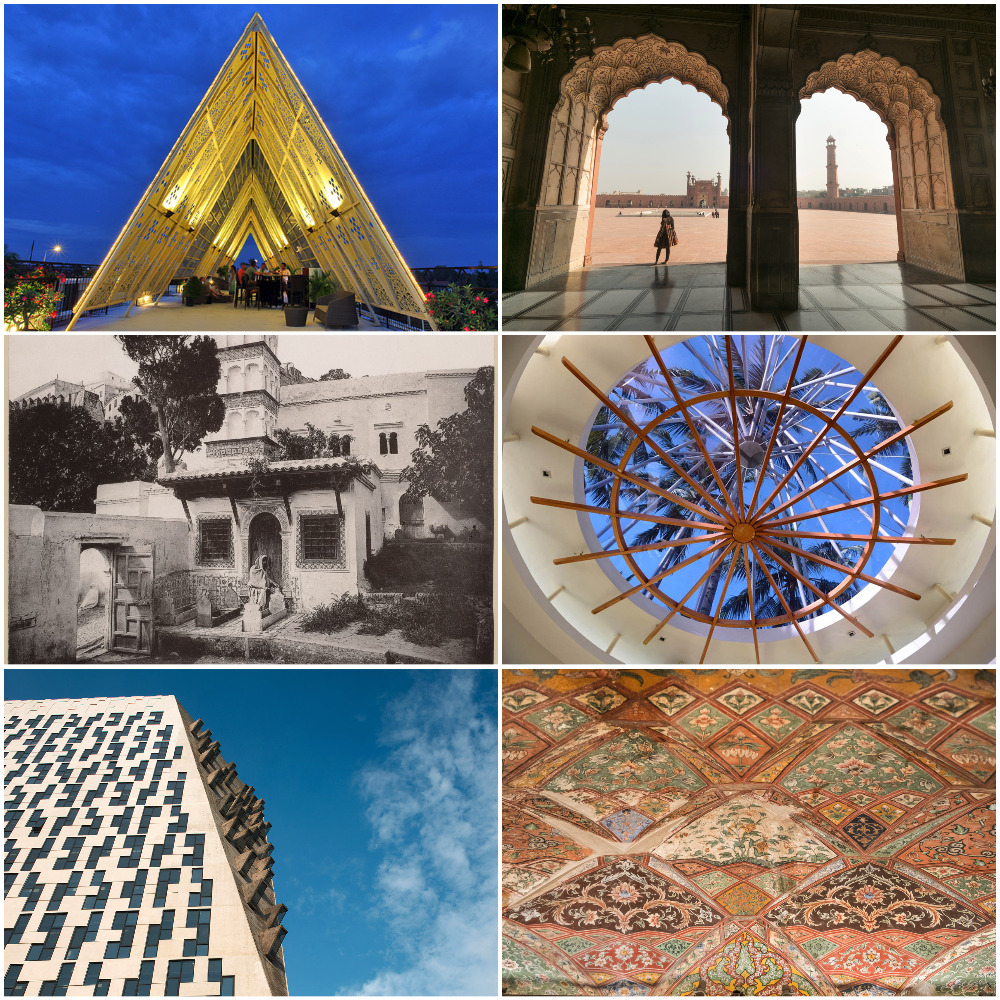
Six of 11,356 images published on Archnet in 2017. See more.
Approximately 12,357 records were published in Archnet between January 1 and December 31, 2017, increasing the total number of records by approximately 10%.
While much of the new material expands existing collections, new collections added in 2017 include sketchbooks and other items form from the archive of architect and designer Ali Tayar, the Isfahan Urban History Project undertaken by Lisa Golombek, Renata Holod and Claus Breede between 1974 and 1976, and photographs from the scholarly archives of Marilyn Jenkins-Madina, Curator Emerita, Department of Islamic Art at The Metropolitan Museum of Art; Yasser Tabbaa, a prominent scholar in Islamic art and architecture, and Daniel C. Waugh, Professor Emeritus at University of Washington. Also new in 2017, is a collection of photographs documenting the restoration of the Byzantine Red Monastery Church in Egypt.

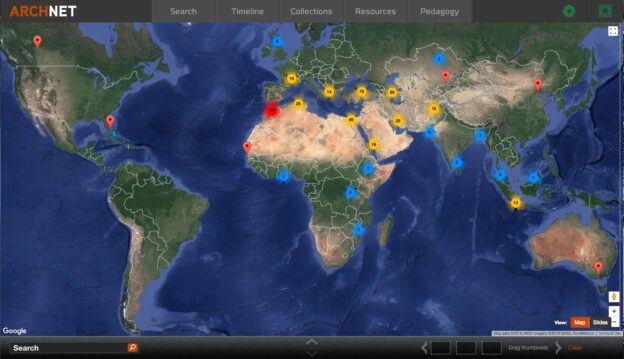
A map indicated the locations of all sites published last year.
468 new sites were published in 2017, along with supporting data, images, and other media. While the vast majority of sites are in parts of the world were Muslims constitute a majority of the population, some are associated with a developing collection focusing on the architecture of minority Muslim populations in Europe. Other sites added in 2017 include the Aga Khan Garden in Alberta, Canada, and the Islamic Museum of Australia, located in Melbourne. To see a sampling of material published since last year, visit the New in 2017 collection.
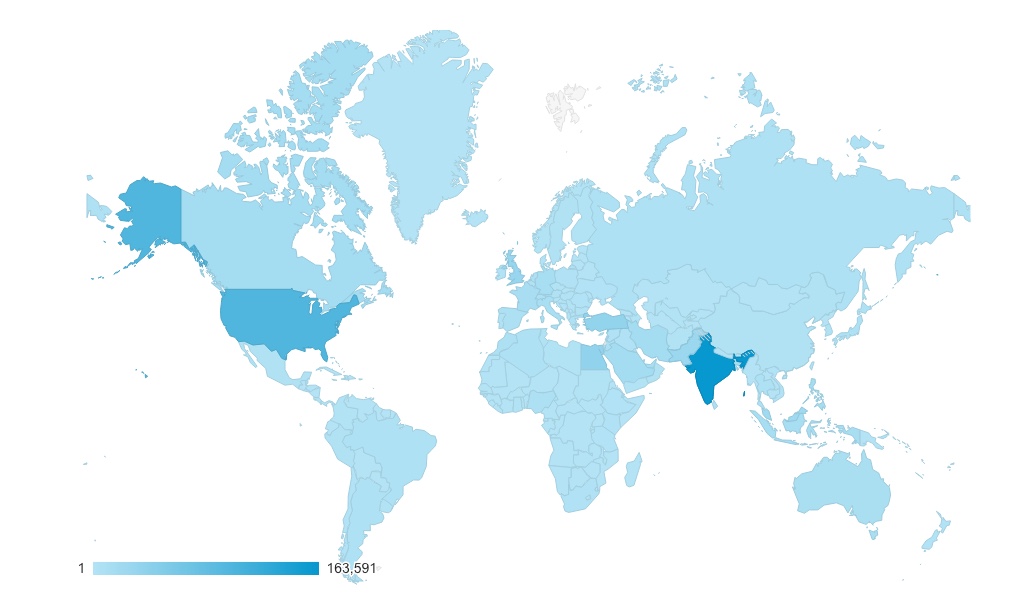
Google Analytics heat map showing the global distribution of sessions, January 1 – December 31 2017.
Archnet’s user base continues to grow. Google Analytics logged 2,928,000 page views last year, a 6% increase over 2016 numbers. The total number of session and unique users both rose by 16%. Archnet’s international appeal continues to grow. While the number of sessions initiated in the US grew by 5% during the 2017 calendar year, the percentage of total sessions initiated from the United States was only slightly higher than 13%. Put another way, 87% of sessions came from outside the United States, largely because of increasing global use. Most prominently, the number of sessions initiated in India rose by 29% over the 2016 total.
We are grateful to all our contributors, partners, and user for your support in 2017. Look for more exciting developments in the new year!